Turning to BI when AI could not process over 200k of restaurant health inspection data
Context
Ever looked at the piles of trash and rodents in NYC and thought about the restaurants right next door? The cleanliness of our food isn’t a mystery. The proof is in a unique pot of gold—the DOHMH New York City Restaurant Inspection Results from NYC’s Open Data portal. It’s a detailed, public record that reveals exactly how well our city’s eateries are maintaining their standards.
This dataset is basically a detailed report of every health code violation from the last three years for NYC’s active restaurants and college cafeterias. It even includes new spots and places with no violations.
Following up from building the MTA bus assistant, I wanted a similar agent to be able to interact with to help me to look up health ratings of NYC restaurants to help me decide whether I should Start, Stop or Continue visiting specific restaurants in the city.
User Story
“As an occasional restaurant diner I want a reliable way to tell me what health rating the NYC restaurant I plan to go to has so that I can feel more at ease enjoying my meal”
My main goal here was to get a conversational agent to answer restaurant health inspection questions.
Basic features
- Chat interface or User Interface so that I could look up information on specific restaurants
- Connection to NYC Open Data’s restaurant inspection results
- Ability to quickly see grades and full list of health inspection violations and the level of criticality of those violations
- Quick stats to see how it was benchmarking against the full restaurant health inspection population in NYC
Development method of choice
I wanted to use n8n to deploy a similar agent like my last post here however, I ran into several problems, and ended up turning to BI tools as I kept facing data quality issues and settled on using Tableau Public.
Limitations using AI
I initially started from the simple n8n AI agent template, and replugged the Get HTTP request node, with the API from DOHMH New York City Restaurant Inspection Results. Although I had hoped that this would work quite similarly to my successful MTA bus assistant, I found several issues in streaming the data due to the volume of records & spent a lot of time reviewing data quality of the results.
Unfortunately, the time it took to run each question was just way too long, and the responses either returned blanks or wrong answers, matching the wrong restaurant VS. my question prompt.
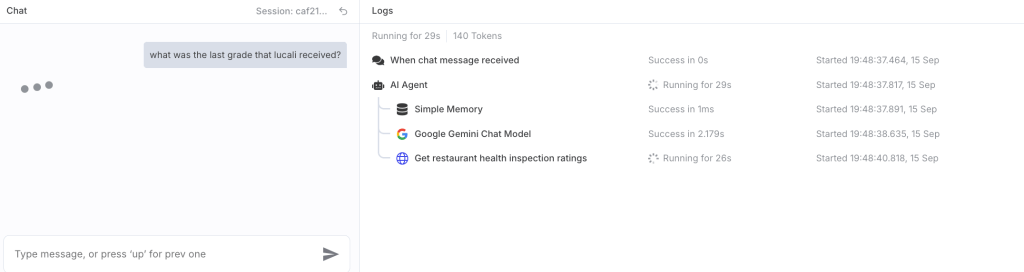

Data matching between what was mentioned in the chat VS. the exact restaurant record in the large 200k row database was just not an easy task for the AI. In order to dive deeper into the data quality issues, I turned to Tableau to look into data. After spending at least an hour or so just checking data quality, I realised this use case was a better fit for BI.
Time it took
Building a BI dashboard has always been a straightforward feat. If you have an OData connector, set up takes around 5 minutes, and building dashboard views can be done in several minutes after.
Overall, the dashboard I built took around an hour max to build including the formatting of the design and charts to dark mode.
Overall thoughts
Although I was disappointed that I could not build a quick agent to overcome this use case, it was a good reminder that some things are just easier with BI tools like tableau or Power BI.
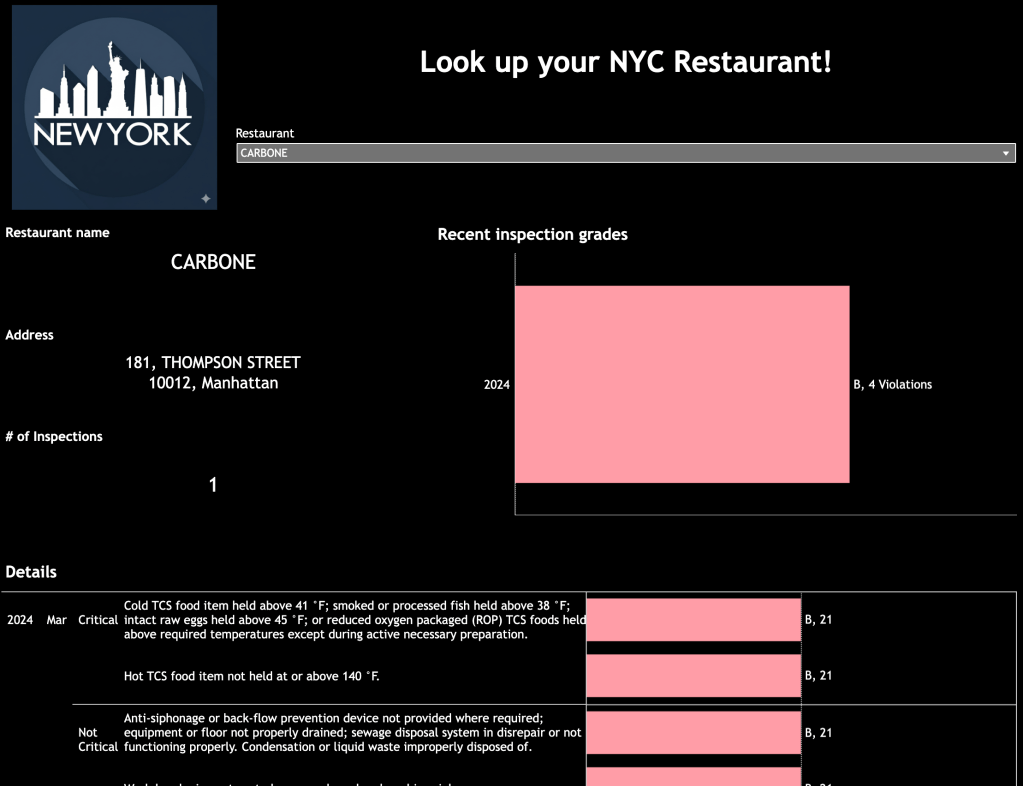
See the real health ratings of the NYC restaurants you’ve visited
Access the dashboard here:
https://public.tableau.com/app/profile/elaina.s8730/viz/NYCRestaurantInspections-Darkmode/Dashboard1
TLDR
I wanted to use AI to analyze NYC’s massive restaurant inspection data, but it couldn’t handle the size. So, I turned to a reliable BI tool instead, which gave me much quicker and more accurate results. Sometimes, the best solution is the classic one.

Leave a comment